Feature
Your Productivity, Visualized
Chronoid turns tracked time into reports, breakdowns, and analytics. Review app, website, path, keyword, project, device, productivity, trend, and billing views from one native Mac workspace.
How the Dashboard Works
1 · Track Automatically
Chronoid captures foreground apps, window titles, browser URLs, and supported resource paths. No manual timer input needed — your report data builds itself.
2 · Open the Dashboard
Open reports from the menu bar or main window. Choose from today, week, month, quarter, year, or custom date ranges to view your data.
3 · Discover Patterns
Spot trends in your work habits. See which hours and days are most productive, how time splits across projects, and how billable work changes over time.
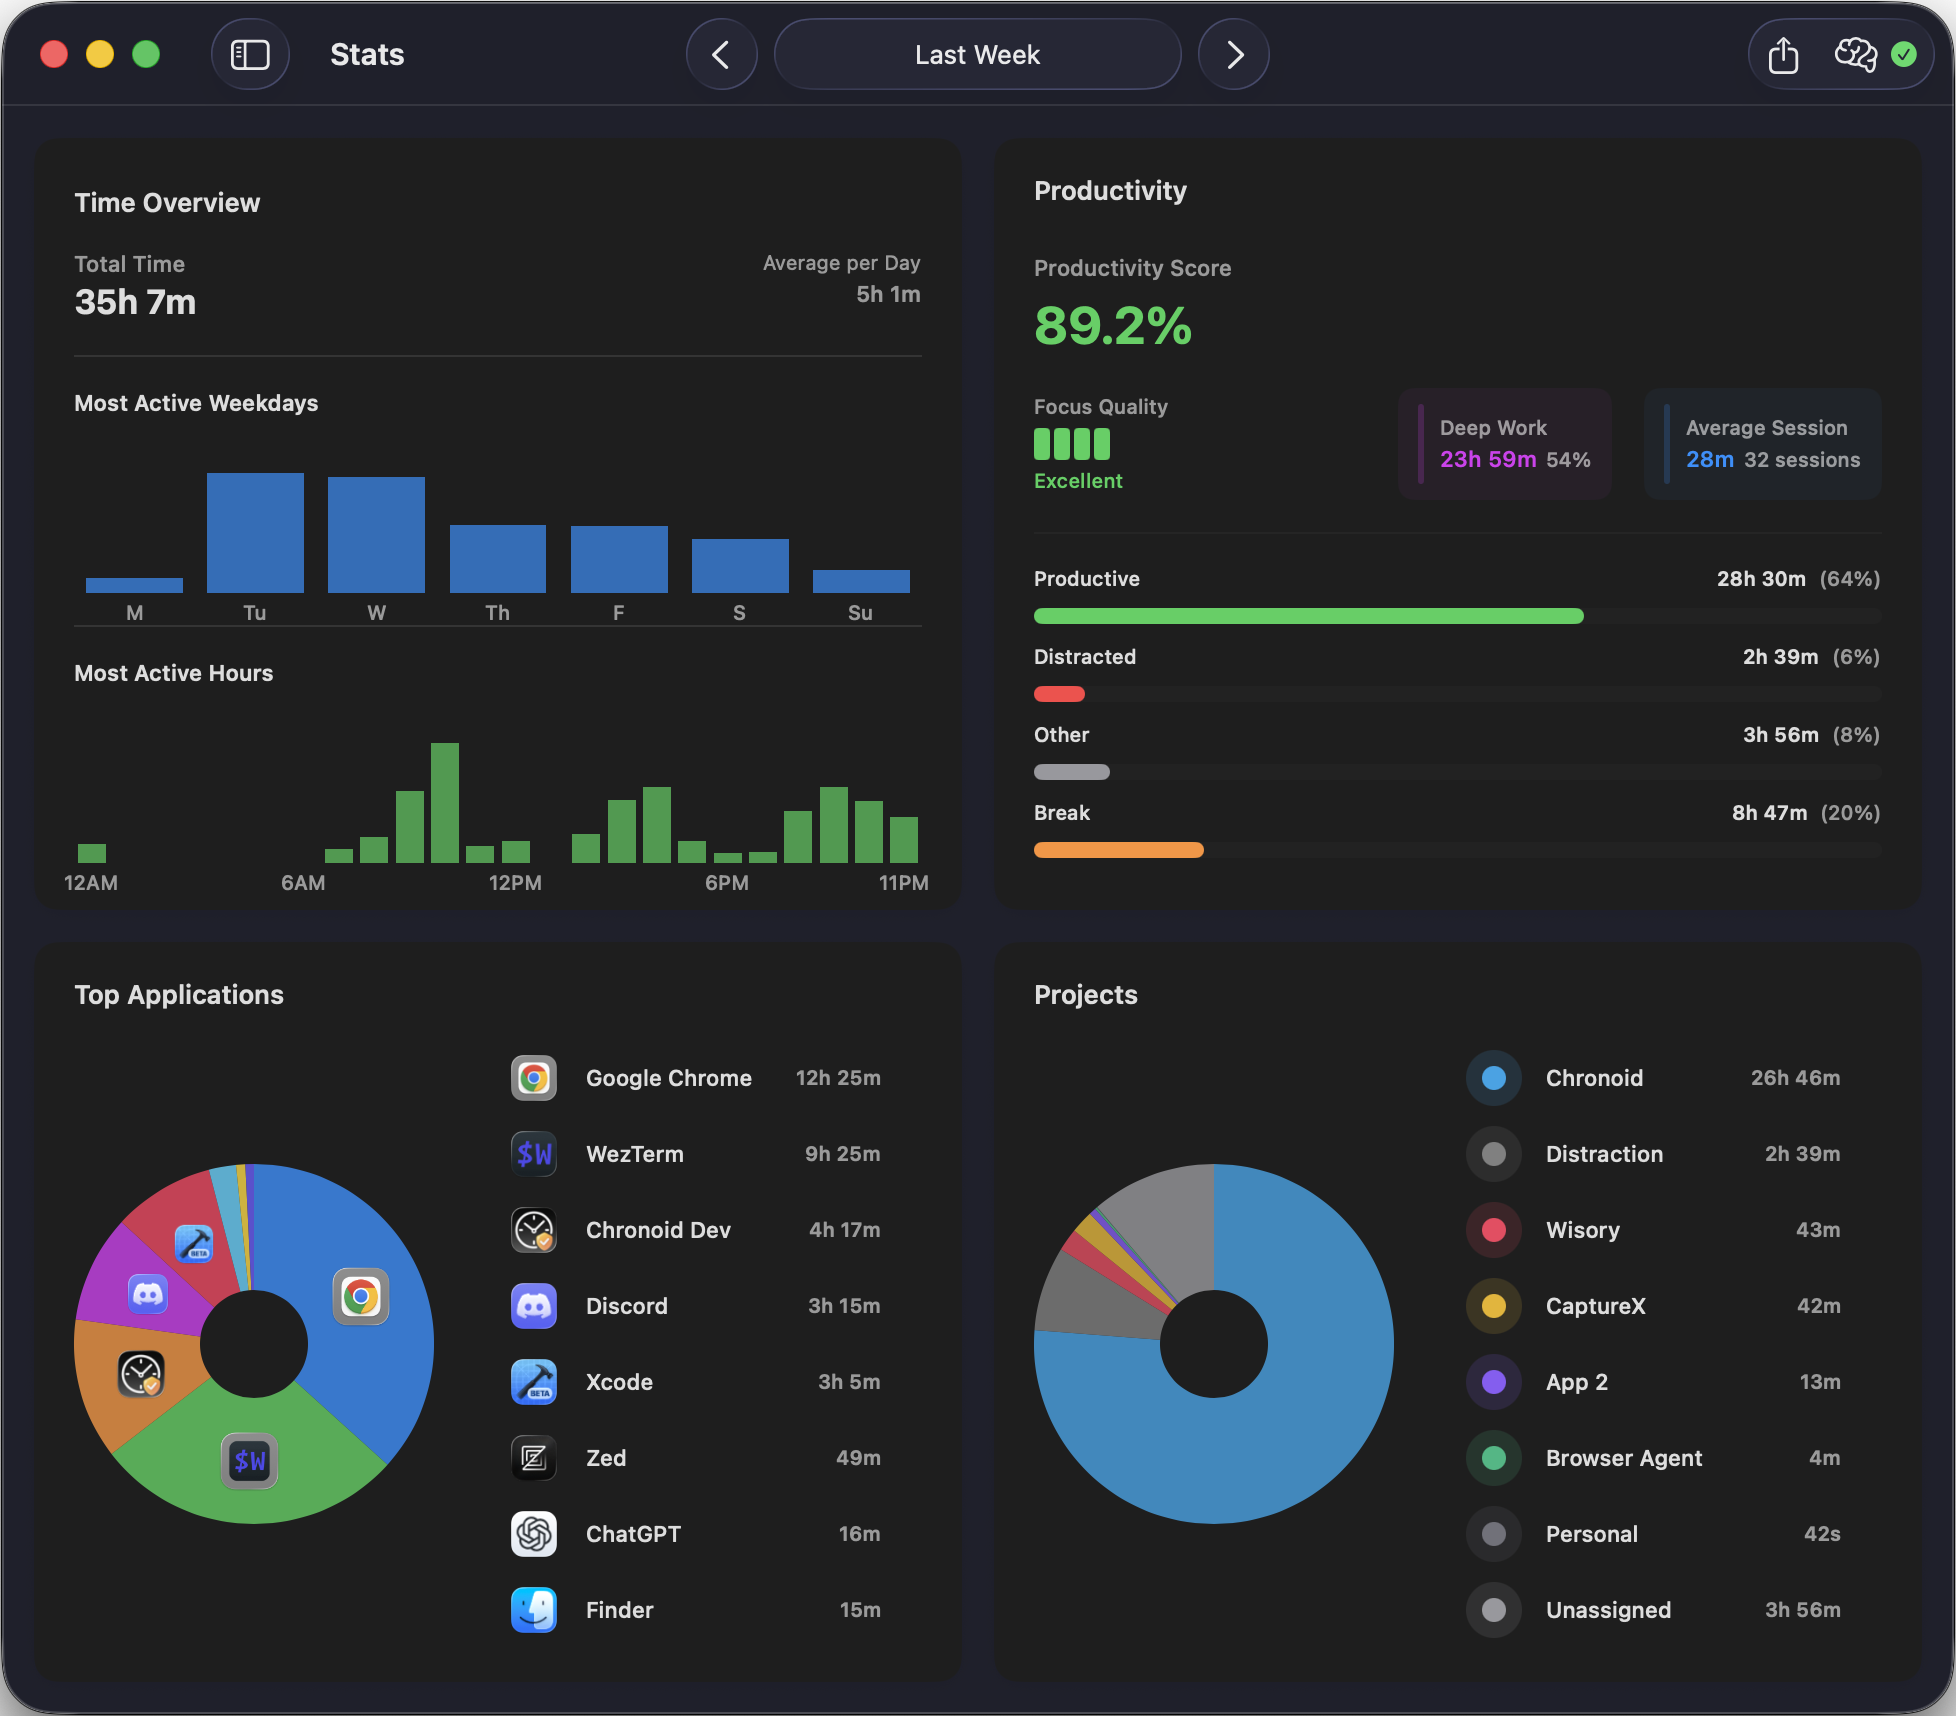
The real thing, on your Mac
Time distribution charts by project, top apps and websites, hourly and weekday patterns — all computed locally from your tracked activity and updating in real time as you work.
Key Benefits
Activity Rings
Apple Watch-style rings visualize productive, neutral, and distracting time. Daily rings show how each day in a selected range compares.
Hourly Distribution
See how your time distributes across the day. Identify your peak productivity hours and plan your schedule around them.
Weekday Patterns
Compare productivity across different days of the week. Discover which days you're most focused and which have the most context switching.
Productivity Trends
Track how your productivity changes over weeks and months. See if your habits are improving or if you need to adjust your workflow.
Project Allocation
Visualize how your time splits across projects and unassigned activity. Pie charts and scrollable lists help you balance workload and clean up uncategorized time.
Report Breakdowns
Drill into applications, websites, file paths, and keywords. Search, filter by project or device, and use multi-select batch actions from report rows.
Frequently Asked Questions
How quickly does the dashboard update?
The dashboard updates in real time as Chronoid tracks your activities. You'll see your current session reflected immediately, with charts and rings updating as you work.
Can I export dashboard data?
Yes. Reports can export the current filtered view, and activity export supports CSV options such as notes, unbilled-only filtering, quarter-hour rounding, and weekday filters.
What are activity rings?
Inspired by Apple Watch, activity rings are circular visualizations for your activity mix. Chronoid uses rings for productive, neutral, and distracting time, including per-day rings across the selected range.
Related: Automatic time tracking · Projects · Invoicing & reports
See where your time really goes
Try Chronoid free for 7 days. No credit card required. Your dashboard starts building from the moment you install.